Introduction
RISE provides a comprehensive collection of RNA-RNA interactions (RRIs) identified in human, mouse and yeast, together with extensive molecular annotations for each RRI. The RRIs were curated from transcriptome-wide sequencing studies and targeted sequencing studies, as well as other public databases and datasets.
Currently, RISE curated 260,886 Transcriptome-wide and 35,143 targeted RRIs in human, mouse and yeast transcriptomes. RISE also includes 32,782 RRIs from other databases.
Here, we briefly describe the database construction pipeline, consisting of four steps: (i) raw data collection, (ii) data preprocessing, (iii) data annotation, and (iv) data visualization.
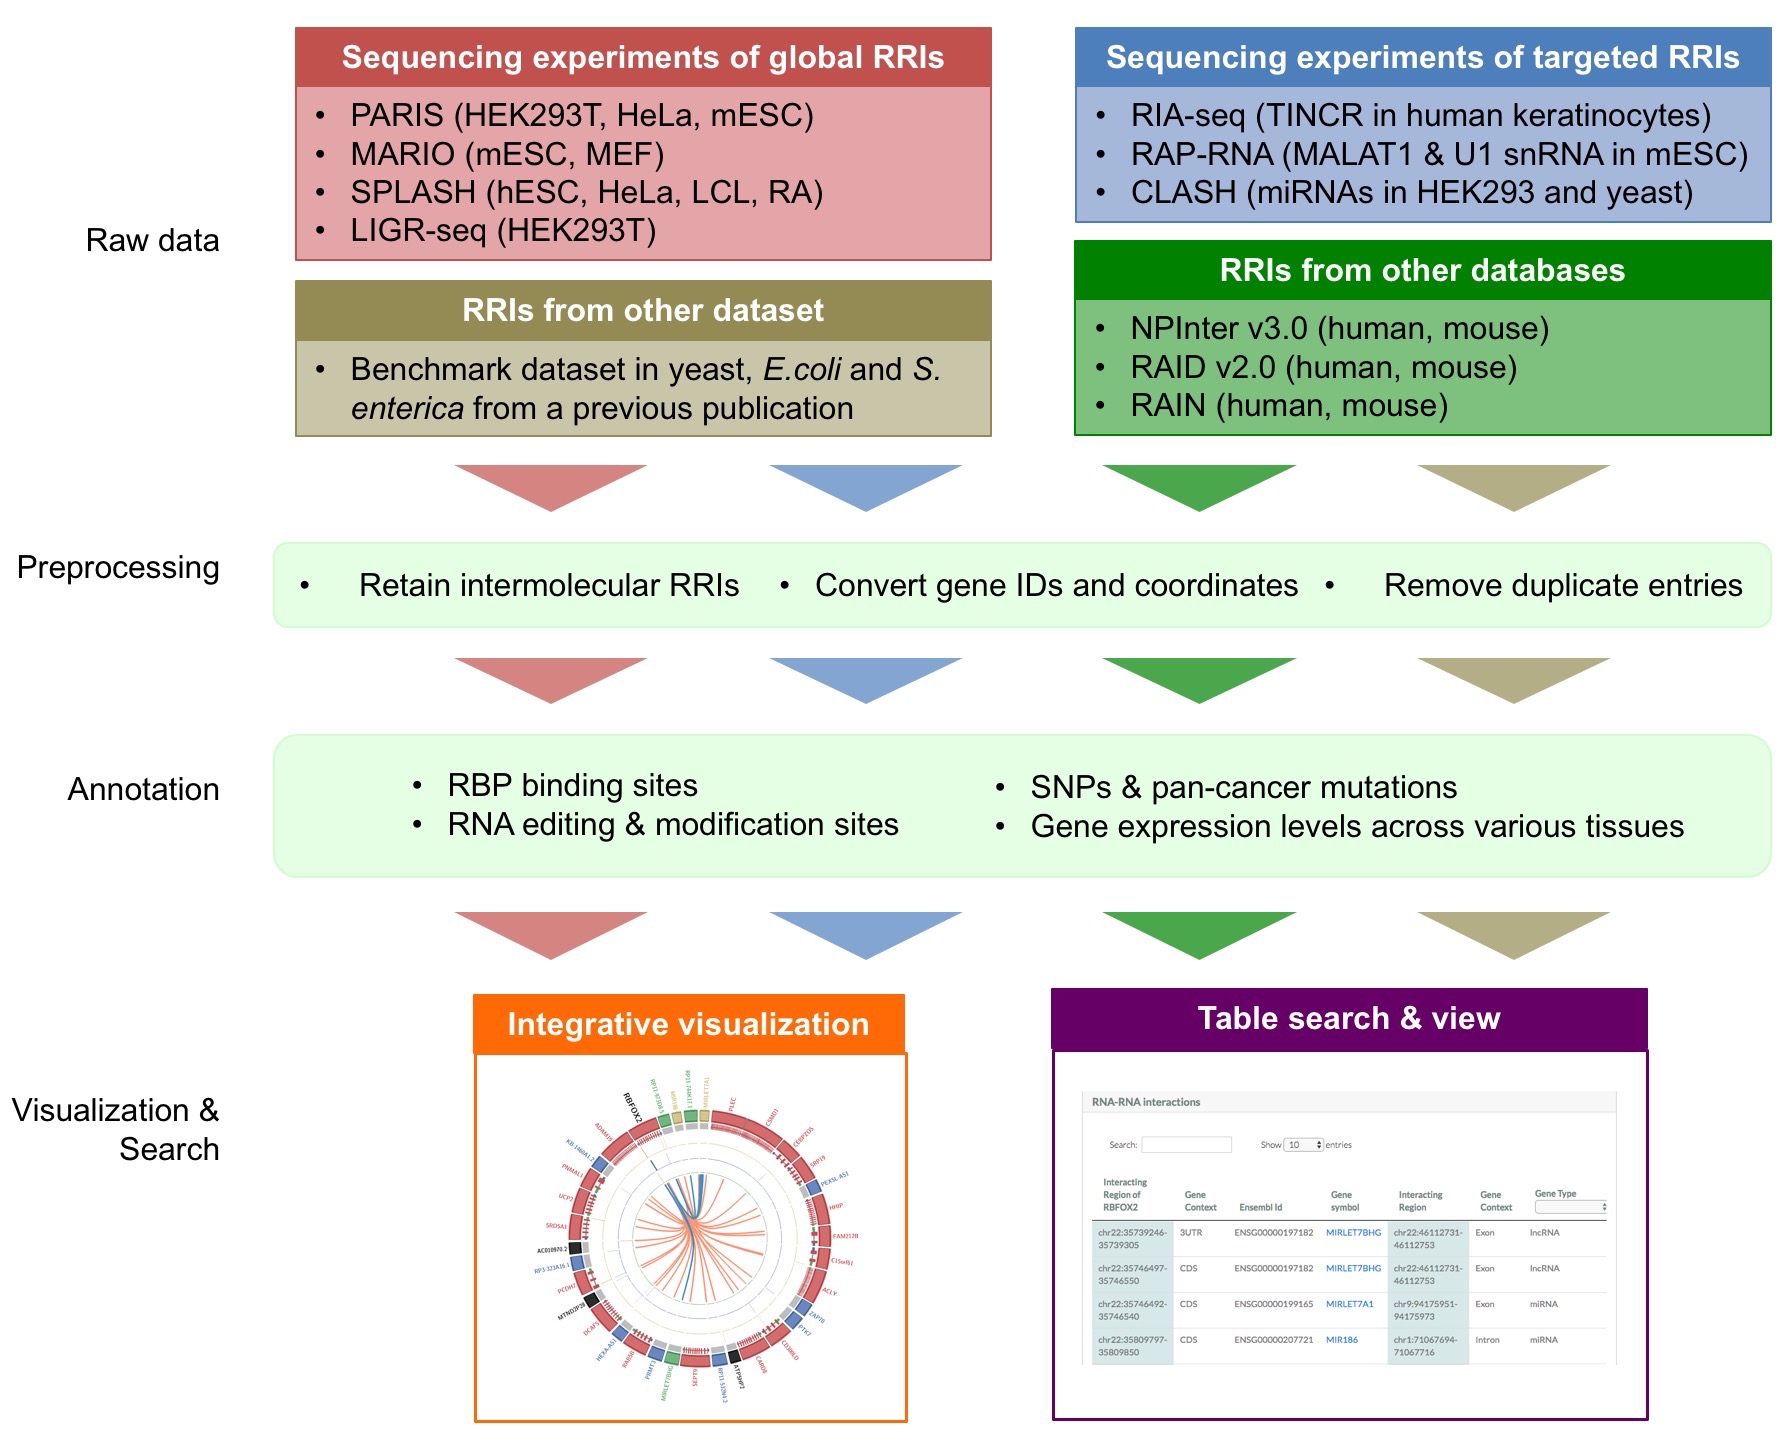
First, we collected RRIs from transcriptome-wide [1,2,3,4] and targeted [5,6,7,8] sequencing experiments,together with RRIs from other databases [9,10,11] and publications [12].
Then, we performed quality control to obtain non-redundant and intermolecular RRI entries.
Next, we annotated RRIs with extensive molecular and functional information, including (i) RBP binding sites [14], (ii) RNA editing and modification sites [15,16,17], (iii) SNPs and pan-cancer mutations [18,19], as well as (iv) gene expression levels from various cell and tissue types [20].
Finally, RISE provides integrative visualization and table view for the search results.
RISE web interface is easy to use. Here is an example showing how to search the website and read the results (i.e. circus plot and table view).
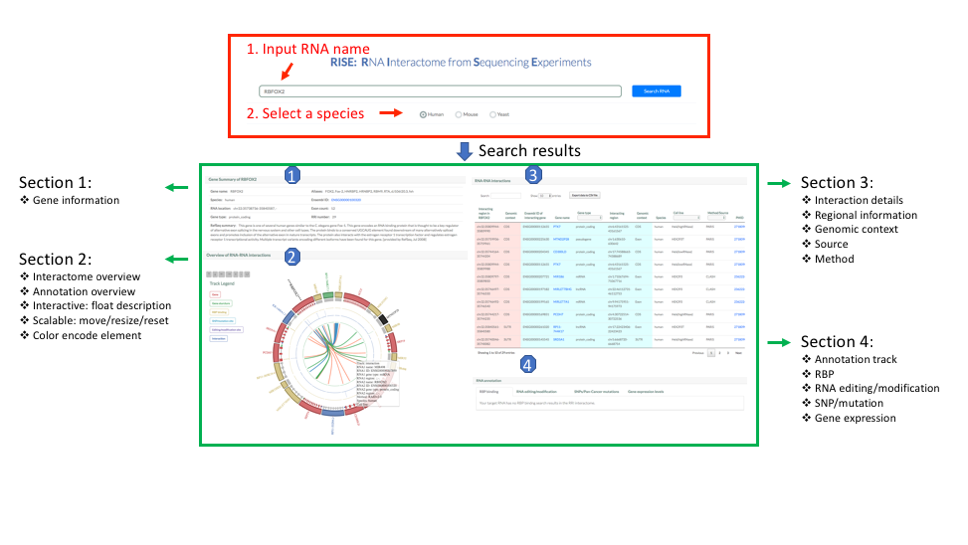
You should first enter a gene name. The server will automatically complete the full gene name according to your input. Then, you should select a species: human, mouse or yeast.

After you submit the query by clicking the “search RNA” button, the server will direct to the result page, which contains multiple sections.
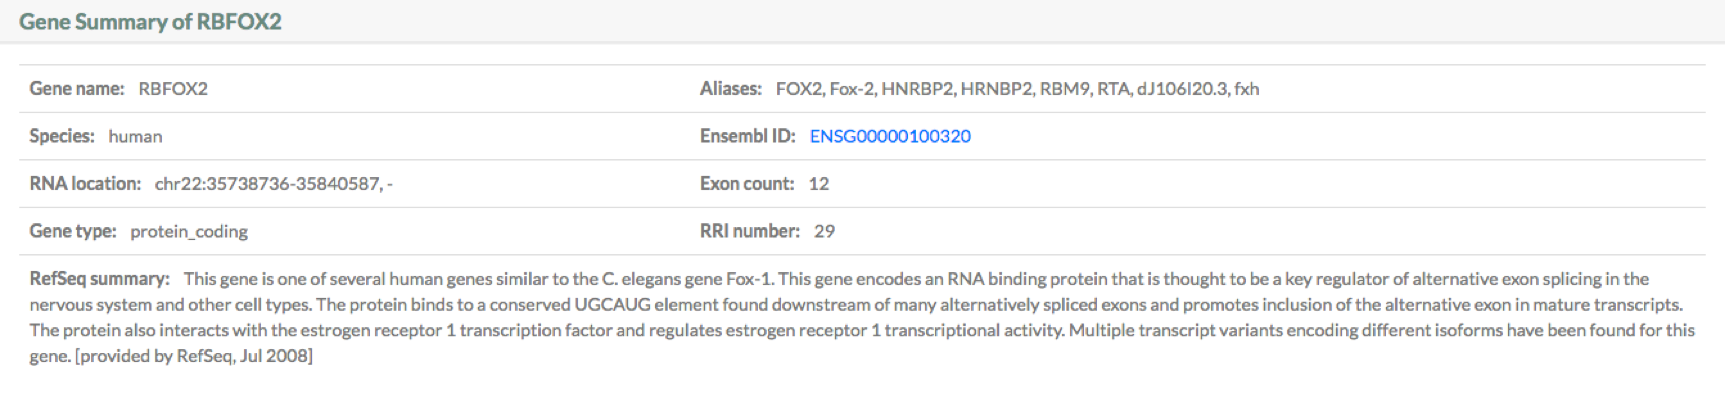
Results section 1: Gene summary
This section provides information on the query gene. It includes:
1. Gene name.
2. Gene Aliases.
3. Species.
4. Ensembl ID.
5. RNA location: the coordinates of the longest transcript of the gene. This annotaion used in RISE are from Ensembl v84.
6. Exon count.
7. Gene type.
8. RRI number: the total number of RRIs on the gene.
9. RefSeq summary.
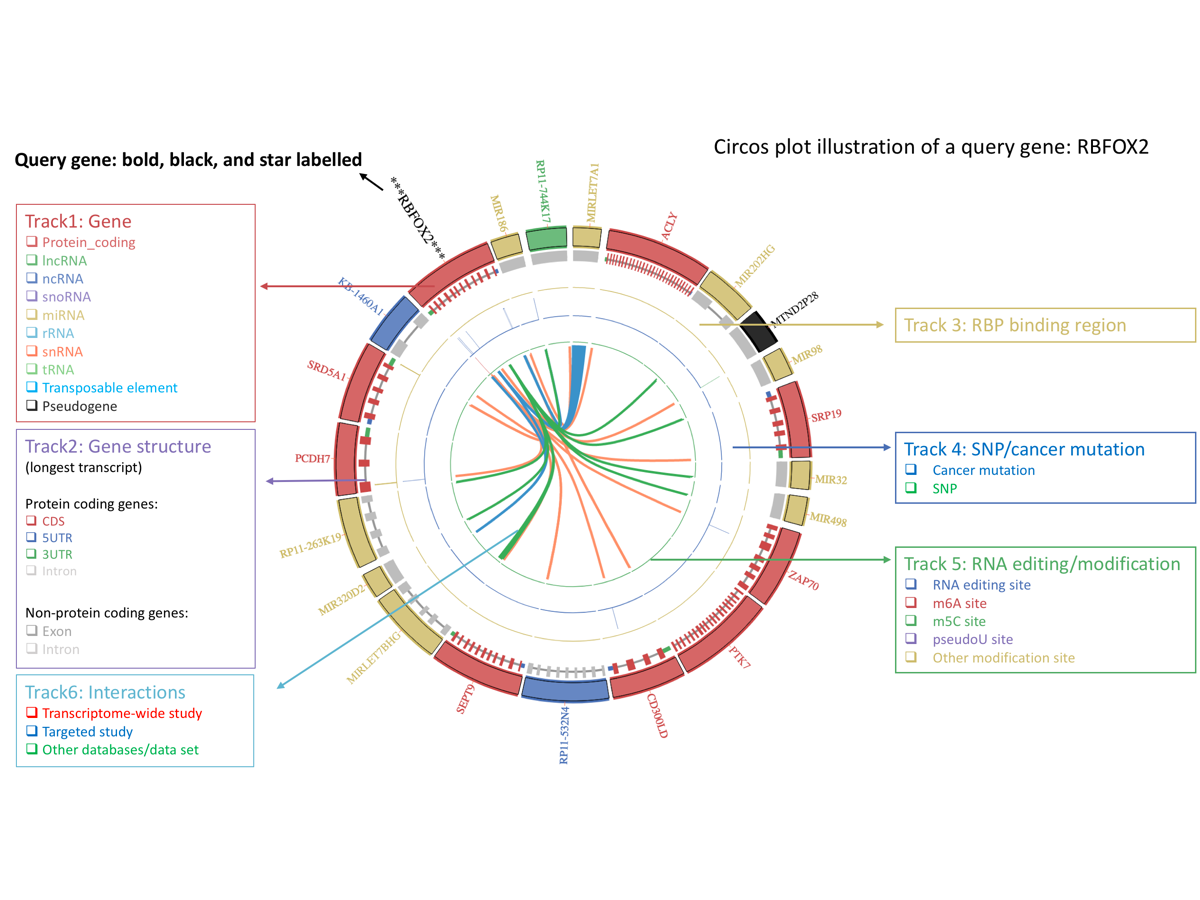
Results section 2: Integrative visualization by circos plot
This section provides integrative visualization of the query gene. Here, we used Circos plot [ circos plot ], a widely used genomic plot style, to show the interactions between RBFOX2 and its partners. In the Circos plot, we added several annotation tracks (i.e., RBP binding track, RNA modification/editing track and SNP/pan-cancer mutation track) to help you know the genomic context of the interacting regions, and study the functions of the RRIs in the gene.
The Circos plot provides 6 tracks as below (from outer to inner):
1. gene track and gene name.
Here each gene is denoted as a block, whose color is assigned based on gene type ( protein coding, lncRNA, ncRNA, snoRNA, miRNA, rRNA, snRNA, tRNA, Pseudogene, transposable element, others ) . The color of the gene name is the same as the block, expect the query gene ( here is RBFOX2 ), which is bold, black and star labeled (***RBFOX2***).
2. gene structure.
The second track depicts the details of the gene structure of the involved RNAs by using annotations from Ensembl [13]. For genes with multiple isoforms, the longest transcript is displayed. Each gene structure element is assigned a unique color based on its type: Exon (if there is no CDS), Intron, CDS, 5UTR, 3UTR , and intron is thinner than other elements.
3. RBP binding sites.
The third track provides RBP (RNA binding protein) binding information of the interaction regions from CLIPdb [14]. Only site falls into any interaction region be shown, so are the same as SNP/pan-cancer mutation track and RNA editing/modification track.
4. RNA editing and modification sites.
The fourth track integrates RNA editing and modification information, and the color is assigned based on the specific type: RNA editing, m6A, m5C, PseudoU and other modifications.
5. SNPs and pan-cancer mutations.
The fifth track displays the SNP [18] and Pan-Cancer [19] mutations with different colors.
6. RRIs.
The query gene and its partner are connected by links. Link color is assigned based on different source: transcriptome-wide sequencing studies, targeted sequencing studies and from other databases or data sets.
The Ciscos plot is interactive and scalable.
You can visualize the rich information in the Circos plot in an interactive manner. If you put your mouse pointer over the track you are interested in, you will see the detailed description of this track in the box. In addition, you can use the four arrows to adjust the position of the plot in the window. You can also use the +/– buttons to zoom in or zoom out the plot. You can use the refresh button to reset the plot to its original state quickly.
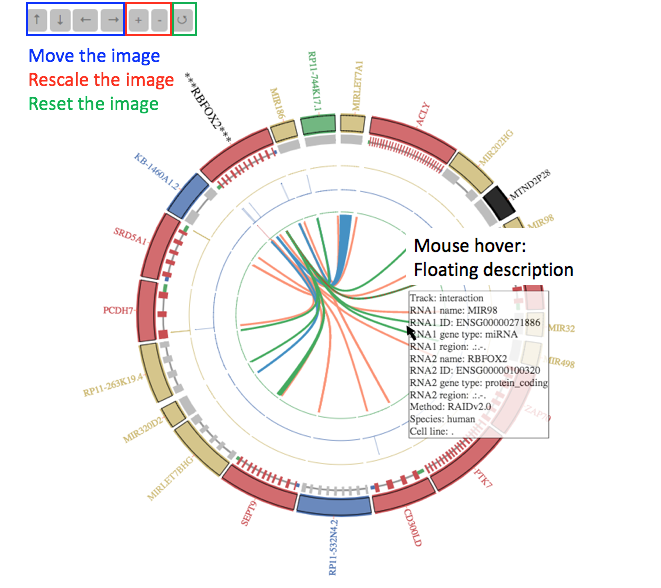
Note: All the coordinates used in the plot are log2 scale transformed.is an example.
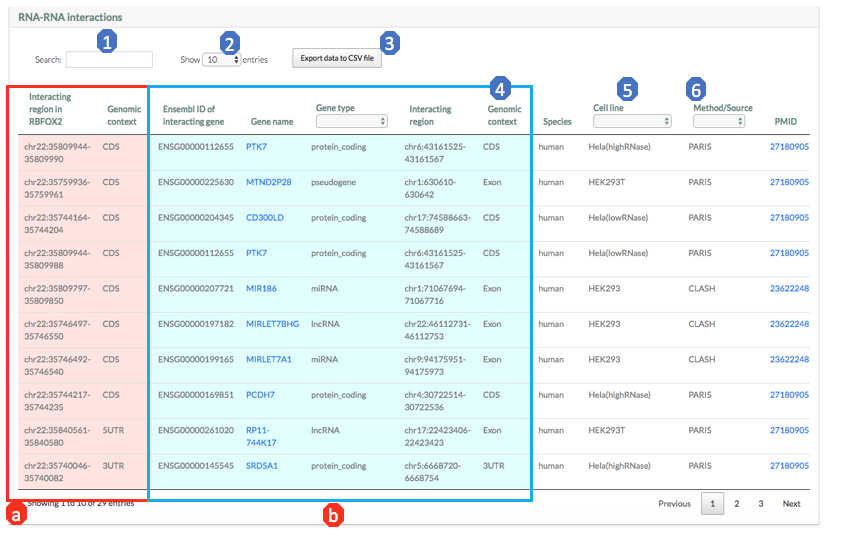
Results section 3: RRI table
This section provides the details of the RRI queries involving the gene. Each row shows a RRI query containing information of genomic elements, interaction regions and source information.
Different colors are used to distinguish the query gene (red) and its interacting genes (blue):
a). Interacting regions on RBFOX2 (red): Coordinates of the RRI region on RBFOX2.
b). Interacting regions on its partner genes (blue): Coordinates of the RRI regions on its interacting genes.
Note that for the RRIs collected from other databases, there are no information on their interacting regions on both the query gene and its partner genes.
Here are brief exploration for each column of the table:
1. Search: Input search term (e.g., gene name) to retrieve the entries that contain the term, which is convenient to check whether there is a specific interaction partner, or specific genomic structure interaction (e.g. 3UTR).
2. Show different number of entries in the page by show select button.
3. Export data to CSV file: Download all information in results table to CSV file.
4. Gene type (blue): Users can select specific gene type of the interacting genes.
5. Cell line: Users can select specific cell line. Note that RRIs from other databases do not have cell line information.
6. Source: Users can select specific experimental technology or database.
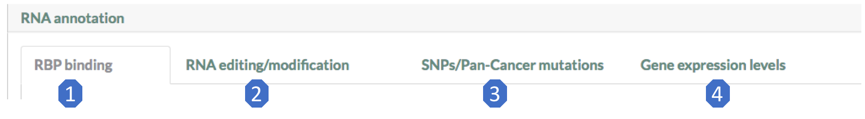
Results section 4: Annotation table
There are four annotation modules for the RRIs in the query gene:
1. RBP bindings
2. RNA editings/modifications
3. SNP/pan-cancer mutations
4. gene expression levels
Here is the detail information of each annotation module.
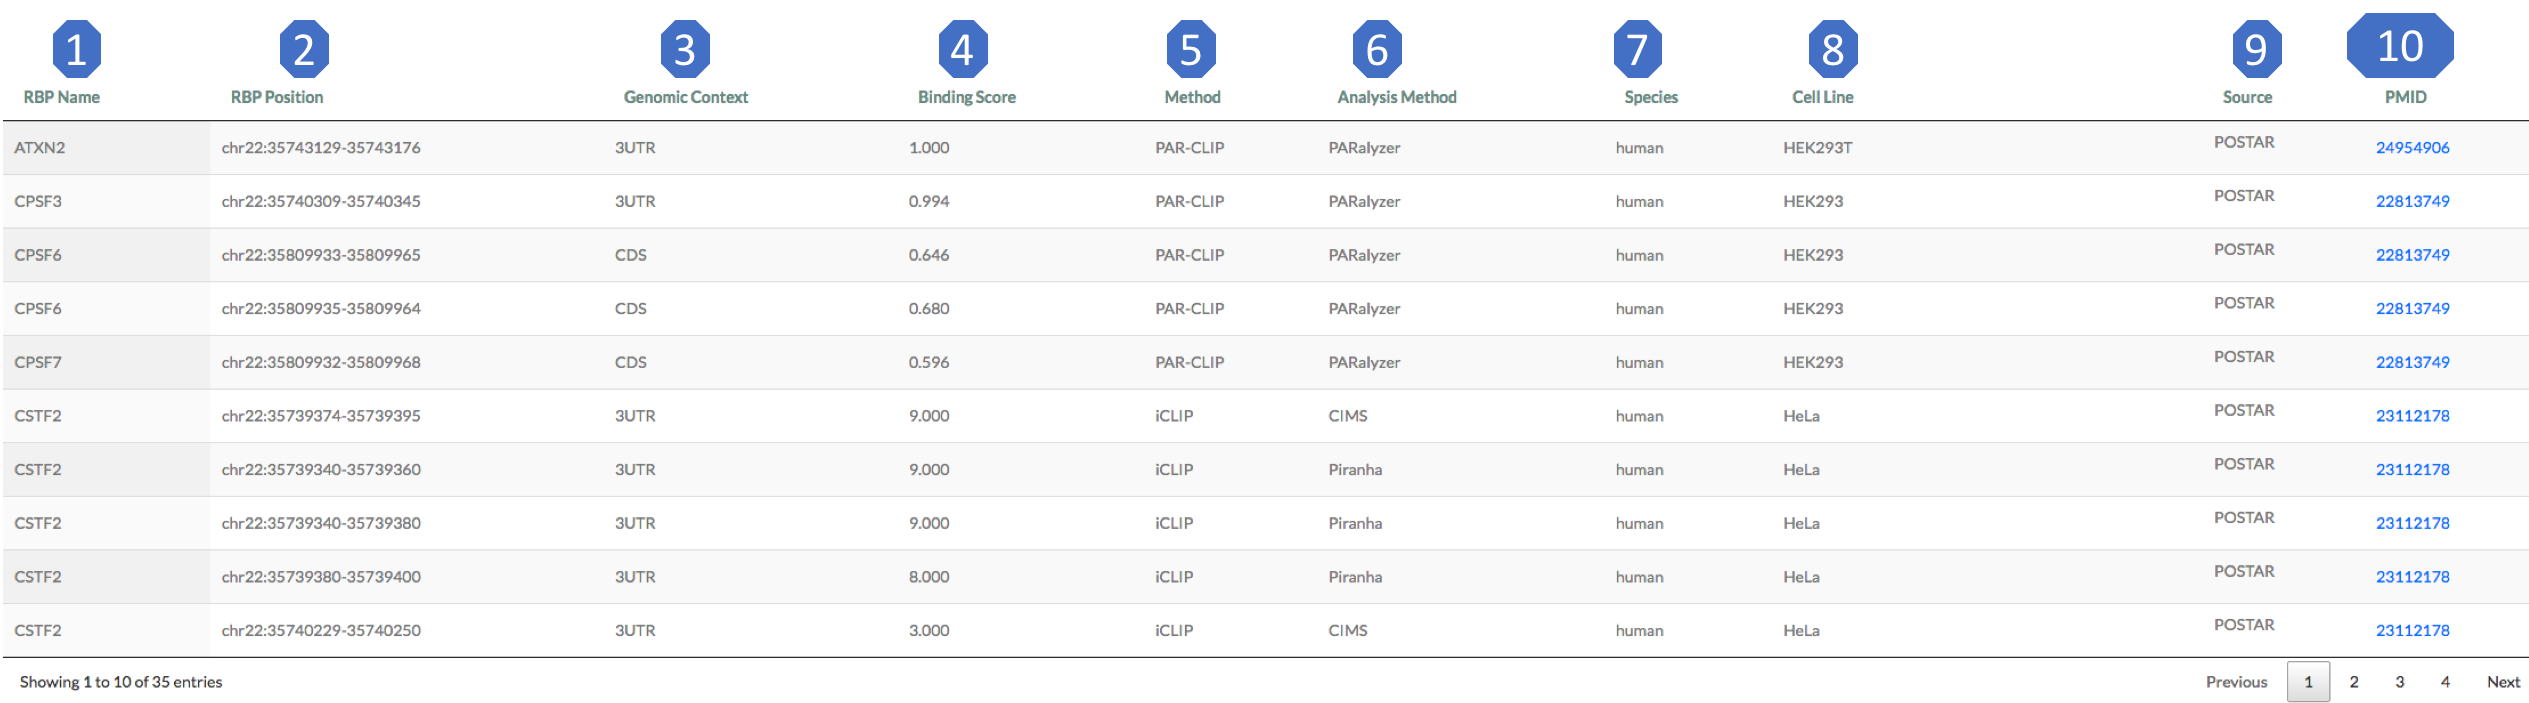
1. RBP binding
This module shows the RBP binding sites located in the RRI regions. Here are brief exploration for each column of this table:
1. RBP name: RNA binding protein name.
2. RBP position: RBP binding region on the RNA.
3. Genomic context: genomic context of RBP binding region.
4. Binding score: RBP binding score calculated in CLIPdb [14] .
5. Method: experimental method to detect the binding.
6. Analysis method: computational method for binding region calculation.
7. Species.
8. Cell line.
9. Source.
10. PMID: Pubmed ID of the experiment. If there is no original reference provided in source, use the source pubmed id instead.
2. RNA editing/modification
This module contains two sub-modules: (i) RNA editing and (ii) RNA modification.
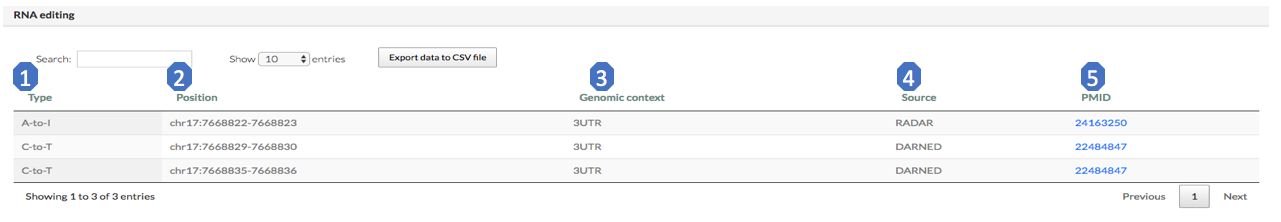
The “RNA editing” sub-module provides the RNA editing sites located in the RRI regions. For RBFOX2, there is no RNA editing sites in its RRI regions.

Here we give an example from TP53. Here are brief exploration for each column of this table:
1. Type: RNA editing type (A-to-I, C-to-I).
2. Position: RNA editing site position.
3. Genomic context: genomic context of editing site.
4. Source: the database that annotate the RNA editing site.
5. PMID: Pubmed ID of the experiment. If there is no original reference provided in source, use the source pubmed id instead.
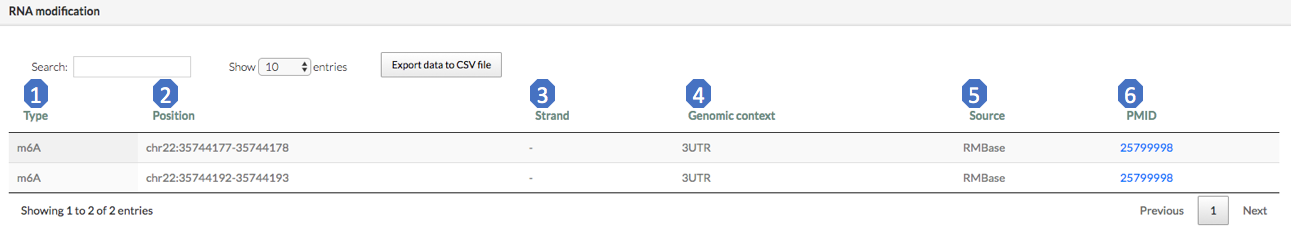
The “RNA modification” sub-module provides RNA modification sites located in the RRI regions. Here are brief exploration for each column of this table:
1. Type: modification type (m6A, m5C, PseudoU, Nm, and others).
2. Position: the coordinate of the RNA modification site.
3. Strand.
4. Genomic context: the genomic context of the modification site.
5. Source: where the modification comes from.
6. PMID: Pubmed ID of the experiment. If no original reference is provided in the source database, use the source Pubmed ID instead.
3. SNP/pan-cancer mutation
This module contains two sub-modules: (i) SNPs and (ii) pan-cancer mutations.
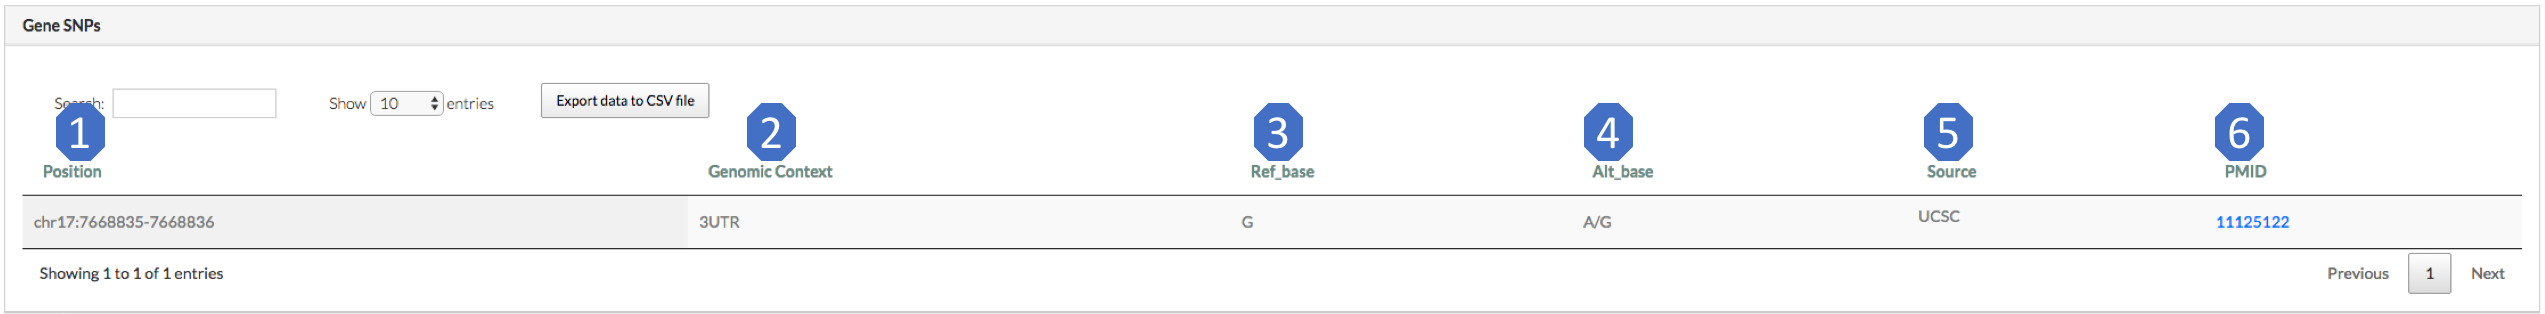
The “SNP” sub-module provides the SNPs (from dbSNP) located in the RRI regions. For RBFOX2, there is no SNPs in its RRI regions.

Here we give an example from TP53. Here are brief exploration for each column of this table:
1. Position: coordinate of the SNP site.
2. Genomic context: genomic context of the SNP site.
3. Ref_base: reference base of the SNP.
4. Alt_base: alternative base in dbSNP.
5. Source: where the SNP comes from.
6. PMID: Pubmed ID of the source (dbSNP here).
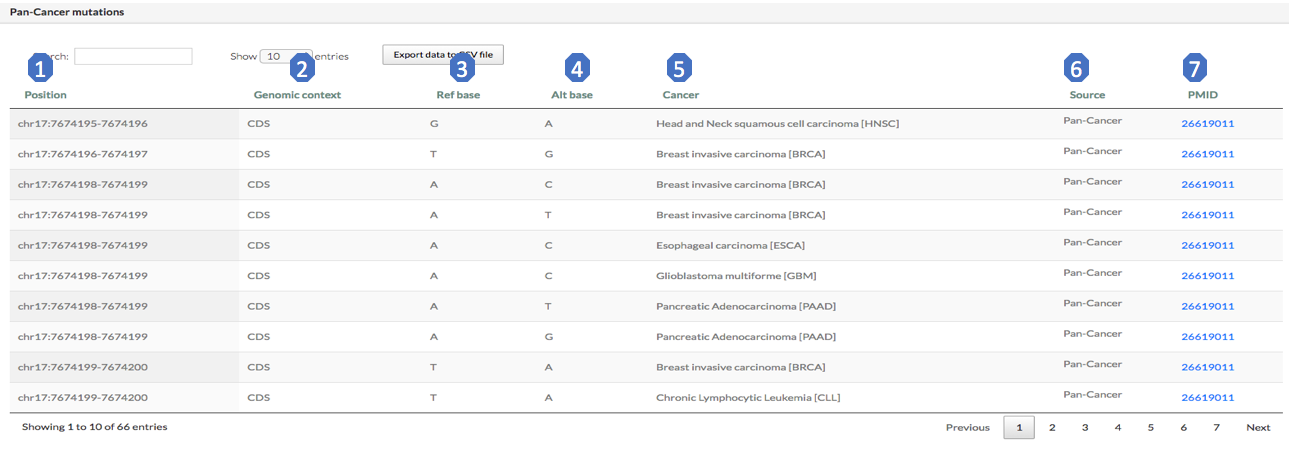
The “pan-cancer mutation” sub-module provides cancer somatic mutations located in the RRI regions. This sub-module includes somatic mutations from more than 40 cancer types. Here are brief exploration for each column of this table:
1. Position: coordinate of the mutation site.
2. Genomic context: genomic context of the mutation site.
3. Ref base: reference base on the position.
4. Alt base: mutated base on the position.
5. Cancer: cancer type, full name and short name.
6. Source: where the mutation comes from.
7. PMID: Pubmed ID of the source.
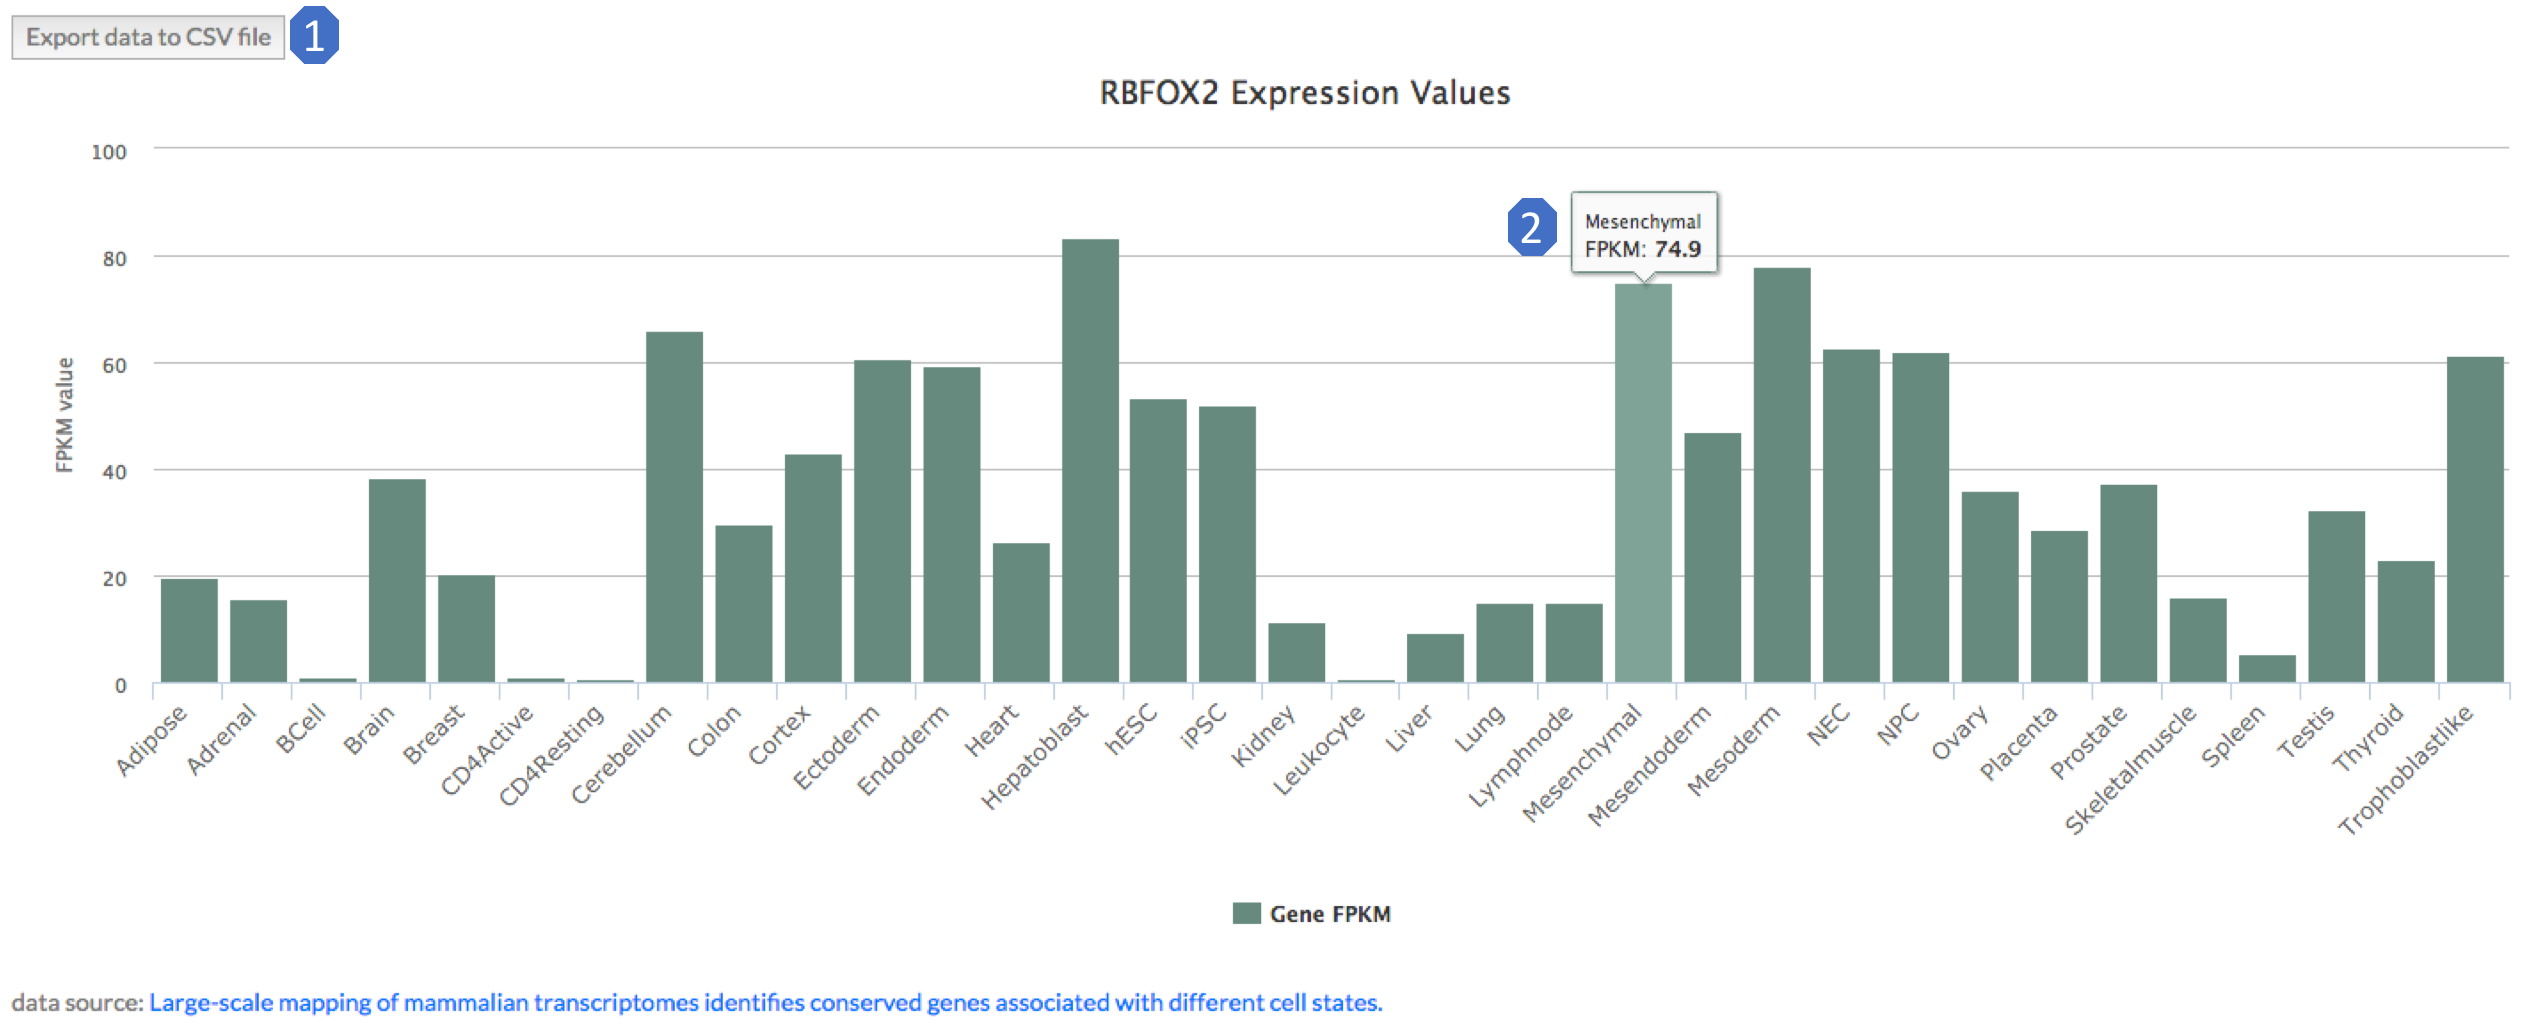
4. gene expression levels
This module provides the expression levels of query gene across various cell and tissue types. We provide expression levels in 34 cell and tissue types in human, and 18 cell and tissue types in mouse.
There are two main features in the table:
1. Download the expression data.
2. The bar plot is interactive. If you put your mouse pointer over the bar, the RPKM value in that tissue or cell line will be shown.
1. Can I query RISE by gene id or genomic coordinate?
No. Currently RISE only supports query in gene name. In the future we may provide other query formats.
2. Can I search two RNAs at the same time?
No. There is no direct way to search two RNAs, or to check whether they interact with each other in the “Search” page. But you can search either of them first, then go to the “RNA-RNA interactions” result section, search the other RNA in the “Search” box.
3. Can I download all the interaction data?
Yes. The “Download” page provides access to all interaction data deposited in the RISE database.
4. It’s known that RNA1 interacts with RNA2, but why I did not see it in RISE?
Not clear. But different gene names are used in difficult circumstances. You may want to search the RISE database again with another gene alias of RNA1 and RNA2. If you cannot find the interactions, you are welcome to drop us a line: gongj15@mails.tsinghua.edu.cn.
| ID | Category | Methods/Sources | Description | PubMed ID |
|---|---|---|---|---|
| 1 | Transcriptome-wide study | PARIS | Transcriptome-wide RRIs in human cell lines (HEK293T and HeLa) and mESC. | 27180905 |
| 2 | Transcriptome-wide study | MARIO | Transcriptome-wide RRIs in mouse cell lines (MEF and mESC). | 27338251 |
| 3 | Transcriptome-wide study | SPLASH | Transcriptome-wide RRIs in human cell lines (hESC, HeLa, LCL and RA). | 27184079 |
| 4 | Transcriptome-wide study | LIGR-seq | Transcriptome-wide RRIs in human cell line (HEK293T). | 27184080 |
| 5 | Targeted stud | RIA-seq | TINCR-targeted RRIs in human keratinocytes. | 23201690 |
| 6 | Targeted study | RAP-RNA | MALAT1- and U1 snRNA-targeted RRIs in mESC. | 25555582 |
| 7 | Targeted study | CLASH(human) | miRNA-targeted RRIs in human cell line (HEK293). | 23622248 |
| 8 | Targeted study | CLASH(yeast) | miRNA-targeted RRIs in yeast. | 21610164 |
| 9 | Other database | NPInter v3.0 | Curated RRIs in human and mouse. | 27087310 |
| 10 | Other database | RAID v2.0 | Curated RRIs in human and mouse. | 27899615 |
| 11 | Other database | RAIN | Curated RRIs in human and mouse. | 28077569 |
| 12 | Other dataset | Benchmark dataset in Lai, et al, 2016 | Experimentally conformed RRIs in E. coli, S. enterica and yeast. | 26673718 |
| 13 | Gene structure annotation | ENSEMBL | Gene and gene structure information of different species. | 26687719 |
| 14 | RBP annotation | CLIPdb | Provide uniformly identified RBP binding sites of publicly available CLIP-seq datasets. | 25652745 |
| 15 | RNA editing annotation | RADAR | A-to-I editing sites collected from published datasets and identified from high-throughput sequencing datasets. | 24163250 |
| 16 | RNA editing annotation | DARNED | RNA editing sites collected from published datasets. | 20547637 |
| 17 | RNA modification annotation | RMBase | RNA modification sites identified from high-throughput sequencing datasets. | 26464443 |
| 18 | SNP annotation | dbSNP | Public archive for genetic variation. | 11125122 |
| 19 | Pan-Cancer mutation annotation | Pan-Cancer mutation | Somatic mutations across 41 cancer types. | 26619011 |
| 20 | Gene expression | Yang Y, et al, 2016 | Gene expression levels (FPKM values) in 34 human and 18 mouse cell and tissue types. | 27980097 |
